
Observability
The agents dashboard — every run and every agent working, live.

An agent you can’t watch is an agent you have to take on faith. LifeOS doesn’t ask for faith: the agents dashboard shows every run and every agent working, live, on one board.
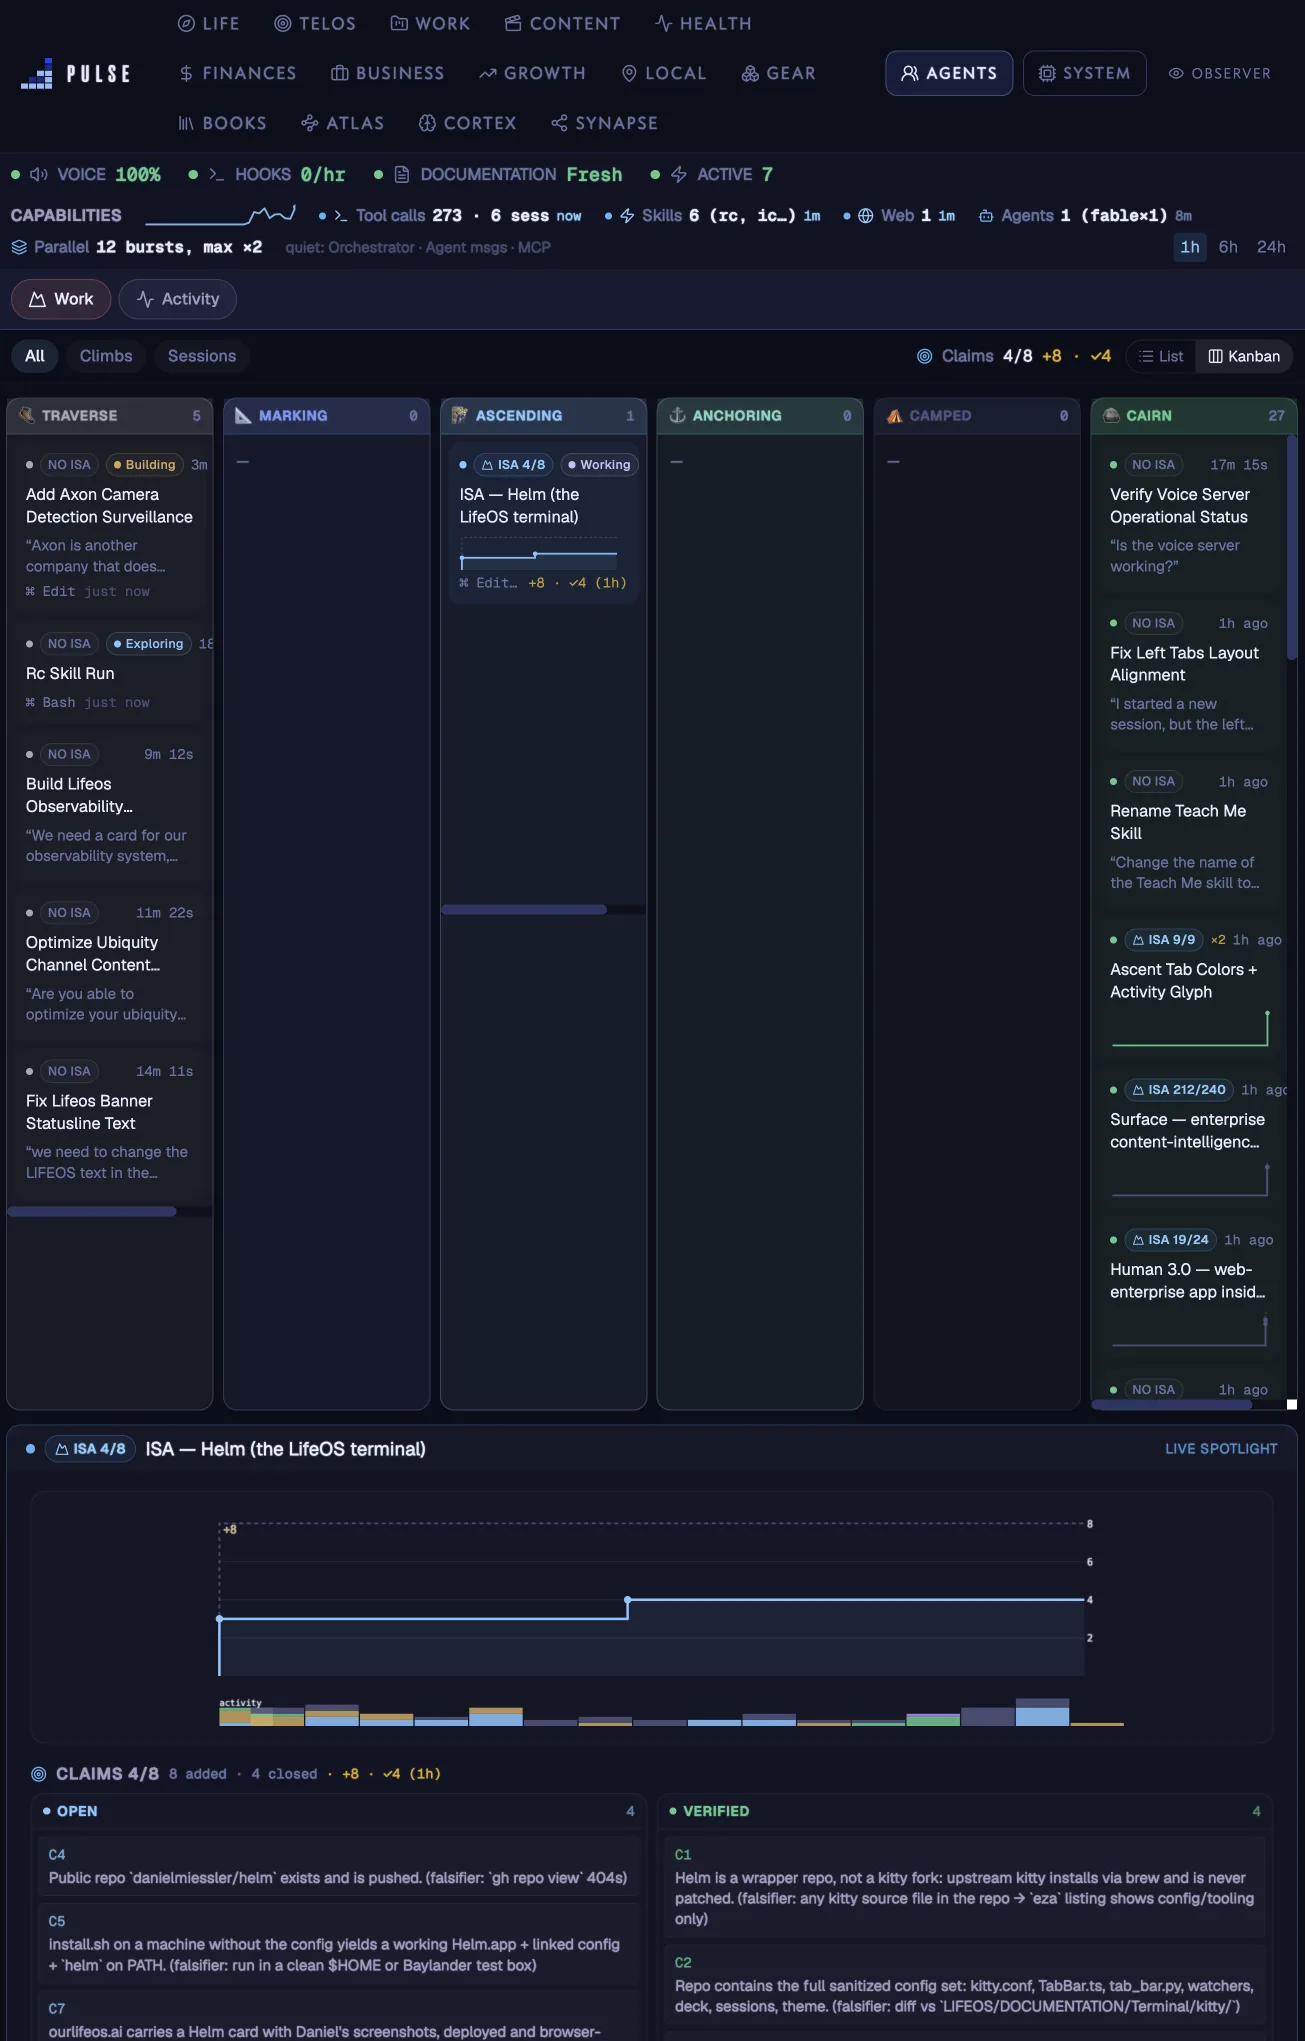
The agents dashboard: runs on a kanban of climb states, a capability strip up top, and a live spotlight on the active run — its altitude over time and every criterion as it opens and closes.
What you’re looking at
-
The kanban of the climb. Every run is a card, and the columns are the states of a climb: Traverse, Marking, Ascending, Anchoring, Camped, and Cairn for finished work. A run’s card carries its ISA criteria count —
4/8means four criteria closed on evidence, four to go. -
The capability strip. Tool calls, active skills, web activity, running agents, and parallelism across the last hour, six hours, or day — the system’s whole workload in one line.
-
The live spotlight. The active run gets a full panel: altitude (criteria closed) over time, an activity histogram, and the criteria themselves — open on the left, verified on the right, each with the falsifier that would prove it wrong.
Why criteria, not logs
Most observability answers “what did the process do?” This board answers a better question: “is the work actually done?” Because every LifeOS run climbs an ISA — a spec whose criteria each name their own test — the dashboard can show progress as verified criteria instead of scrolling log lines. When a card reaches Cairn, that’s not a status someone set. It’s evidence.
Part of Pulse
The agents dashboard is a view inside Pulse, the Life Dashboard at localhost:31337. Pulse shows the whole life system; this view shows the machines at work inside it.